NATIONAL
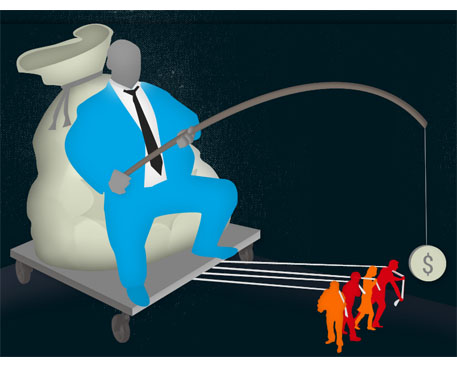
CEO pay is up more than 1000% since 1978
But the typical worker compensation has risen only 12% during that time
The following is from the Economic Policy Institute (EPI):
WASHINGTON, D.C. (Aug. 15, 2019) — CEO pay at the top 350 firms in 2018 was $17.2 million on average, according to new analysis by EPI Distinguished Fellow Lawrence Mishel and Research Assistant Julia Wolfe. From 1978 to 2018, CEO compensation grew by 1008 percent; the compensation of a typical worker, meanwhile, rose just 12 percent. The ratio of CEO-to-worker compensation was 278-to-1 in 2018 — far greater than the 20-to-1 ratio in 1965 and 4.8 times greater than the 58-to-1 ratio in 1989.
 “While wage growth for the majority of Americans has remained stagnant, CEO pay continues to grow strongly the last few years,” said Mishel. “The escalation of CEO compensation has fueled the growth of top one percent incomes and widespread inequality across the country.”
Over the last several decades, CEO pay has grown much faster than corporate profits, the pay of the top 0.1 percent of wage earners, and the wages of college graduates. CEO pay largely corresponds with the overall stock market rather than being tied to the performance of individual firms. Mishel and Wolfe argue this is evidence that CEOs are paid more because of the power to set their own pay through conflicted boards of directors—not because they are more productive or have special talents or more education.
Thus if CEOs earned less or were taxed more, there would be no adverse impact on output or employment.
“Ballooning CEO pay is not a reflection of the market for executive talent,” said Wolfe. “We know this because CEO compensation has grown far faster than even the top 0.1 percent of earners. This means that CEO pay can be curbed with little, if any, impact on the output of the economy or firm performance.”
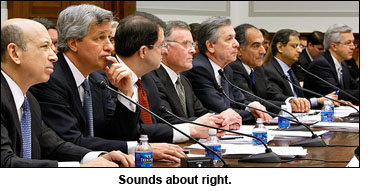
ALSO at The Stand — Executive PayWatch: Rich CEOs get richer, unlike the rest of us (June 26, 2019) — In Washington state, T-Mobile CEO John Legere topped the list of local executives’ pay at $66,538,206 in 2018, which is 1,116 times the Bellevue-based company’s median employee pay. The state’s other highest-paid CEOs in 2018, according to the AFL-CIO report, were Microsoft CEO Satya Nadella ($25,843,263), Seattle Genetics CEO Clay Siegall ($18,107,037), and Funko CEO Brian Mariotti ($16,395,614), who made 411 times what the median employee earned at the Everett-based toy pop culture consumer products company.
 In 2017 and 2018, CEO compensation was driven by stock awards and cashed-in stock options, which averaged $7.5 million in 2018, making up nearly half of CEO compensation. The increased use of stock awards may be leading to an understatement of CEO compensation growth because the growth in stock prices is not reflected in award values.
The authors name several policy solutions that would reduce the ability of CEOs to extract increasingly higher pay—without hurting the overall economy — including:
- Reinstating higher marginal income tax rates at the very top of the income ladder
- Setting corporate tax rates higher for firms that have higher ratios of CEO-to-worker compensation
- Capping compensation and tax anything over the cap
- Allowing greater use of “say on pay,” which allows a firm’s shareholders to vote on top executives’ compensation
Because the decision to realize, or cash in, stock options tends to fluctuate with current and potential stock market trends (as people tend to cash in their stock options when it is most advantageous to do so), Mishel and Wolfe also look at another measure of CEO compensation, tracking the value of stock options at the time they are granted. By this measure, CEO compensation rose to $14 million in 2018, up 9.9% from $12.7 million in 2017.
Each measure of CEO compensation incorporates the value of salary, bonuses, restricted stock grants, and long-term incentive payouts. The two measures employed in the analysis differ in their treatment of stock options. The “stock options realized” measure values stock options as the value of options exercised that year, while the “stock options granted” measure incorporates the value of stock options granted that year. Full methodological details for the construction of EPI’s CEO compensation measure, comparisons to the pay of workers, and benchmarking to other studies can be found in a detailed methodological appendix on epi.org.


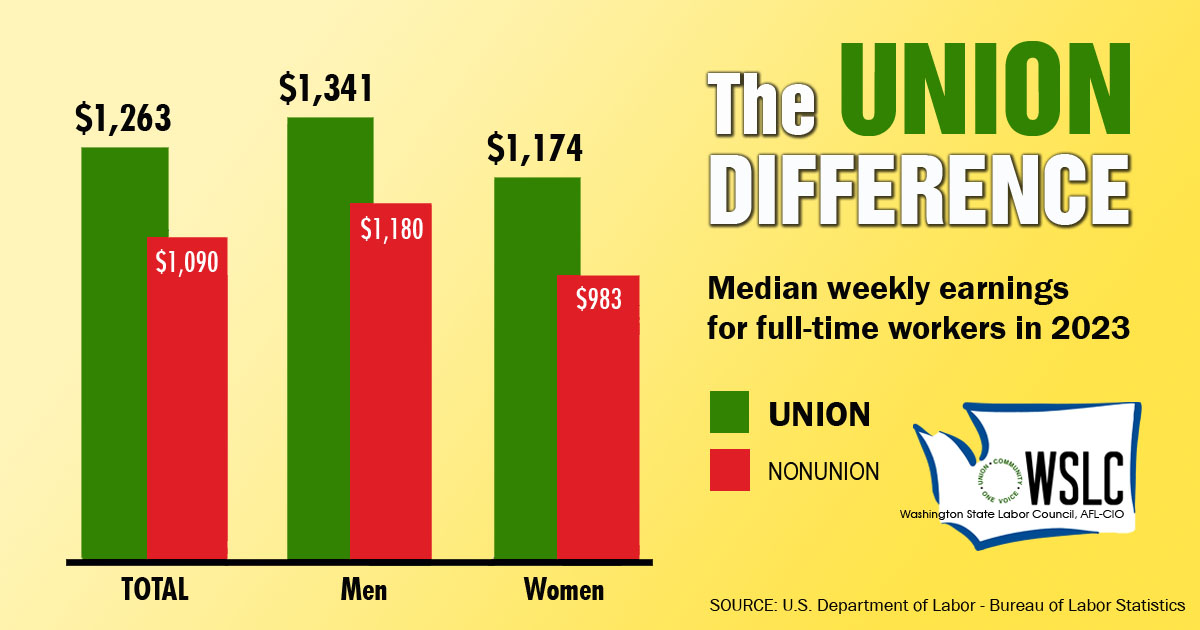
CHECK OUT THE UNION DIFFERENCE in Washington: higher wages, affordable health and dental care, job and retirement security.
FIND OUT HOW TO JOIN TOGETHER with your co-workers to negotiate for better wages, benefits, and a voice at work. Or go ahead and contact a union organizer today!